Bitcoin Enters ‘Danger Zone’ Post-Halving, Analyst Warns Of Potential Downside
April 27 2024 - 2:50AM
NEWSBTC
Following the halving event on April 19, the price of Bitcoin has
displayed a puzzling performance. BTC initially gained nearly 10%
to trade as high as $67,020 on April 24. However, in the last two
days, the digital asset’s price has declined by 6.49%,
falling below the $63,000 price mark. As expected, such
negative performance has drawn attention from investors and market
speculators. In particular, renowned analyst with X handle Rekt
Capital has provided a theory on Bitcoin’s price fall and perhaps
an insight into the future price movements of the crypto market
leader. Related Reading: Timing The Breakout: When Will Bitcoin
Escape The Post-Halving Consolidation? BTC Potential Price Decline
Ahead? In an X post on April 26, Rekt Capital stated that Bitcoin
has now entered the Post-Halving “Danger Zone.” The analyst
described this phenomenon as a period during which Bitcoin has
historically experienced price corrections after the halving event.
Rekt Capital noted that in 2016, Bitcoin recorded these price
retraces in the three weeks following the Halving event. During
this time, the token’s price declined by 11%. The analyst
postulates that Bitcoin is now in the Post-Halving “Danger Zone” of
the current bull cycle following its price fall over the last two
days. It is worth stating that if Bitcoin mirrors past price
movement in this phase, the token could be heading for $60,000.
However, Rekt Capital states that if the crypto market leader
experiences such a fate, it will be within the next two
weeks. At the time of writing, Bitcoin trades around $62,672
with a decline of 2.44% in the last day. This price fall
underscores BTC’s negative performance in the last month in which
it has lost 11.16% of its market value. BTC trades at $63,023
on the daily chart | Source: BTCUSD chart on Tradingview.com
Related Reading: Forbes Unveils 20 Crypto ‘Zombies,’ Declares
Ripple And XRP Among The Undead Bitcoin ETFs Record Minor Inflow;
Net Outflows Hit $217 Million According to data from SoSoValue, the
Bitcoin Spot ETF market recorded net outflows to the tune of $217
million on April 25. Unsurprisingly, Grayscale’s GBTC accounted for
$138 million of these figures as its total outflows now approach
$17 billion. Notably, for the first time ever, Fidelity’s FBTC and
Valkyrie’s BRRR produced net outflows estimated at $22
million and $20 million, respectively. Meanwhile, ARK Invest’s ARKB
and Bitwise’s BITB also experienced a loss in investment on
Thursday. Interestingly, all other Bitcoin Spot ETFs recorded zero
net flows except Franklin Tempton’s EZBC, which saw a net inflow of
$1.87 million. At the time of writing, the BTC spot ETFs have a
combined value of $128 billion, reflecting a remarkable growth
since their trading debut on January 11. Featured image from The
Economic Times, chart from Tradingview
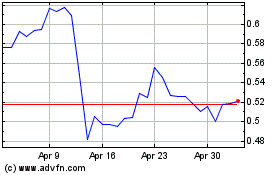
Ripple (COIN:XRPUSD)
Historical Stock Chart
From Mar 2024 to Apr 2024

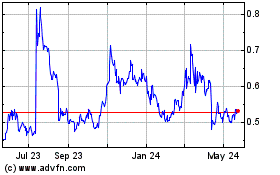
Ripple (COIN:XRPUSD)
Historical Stock Chart
From Apr 2023 to Apr 2024
